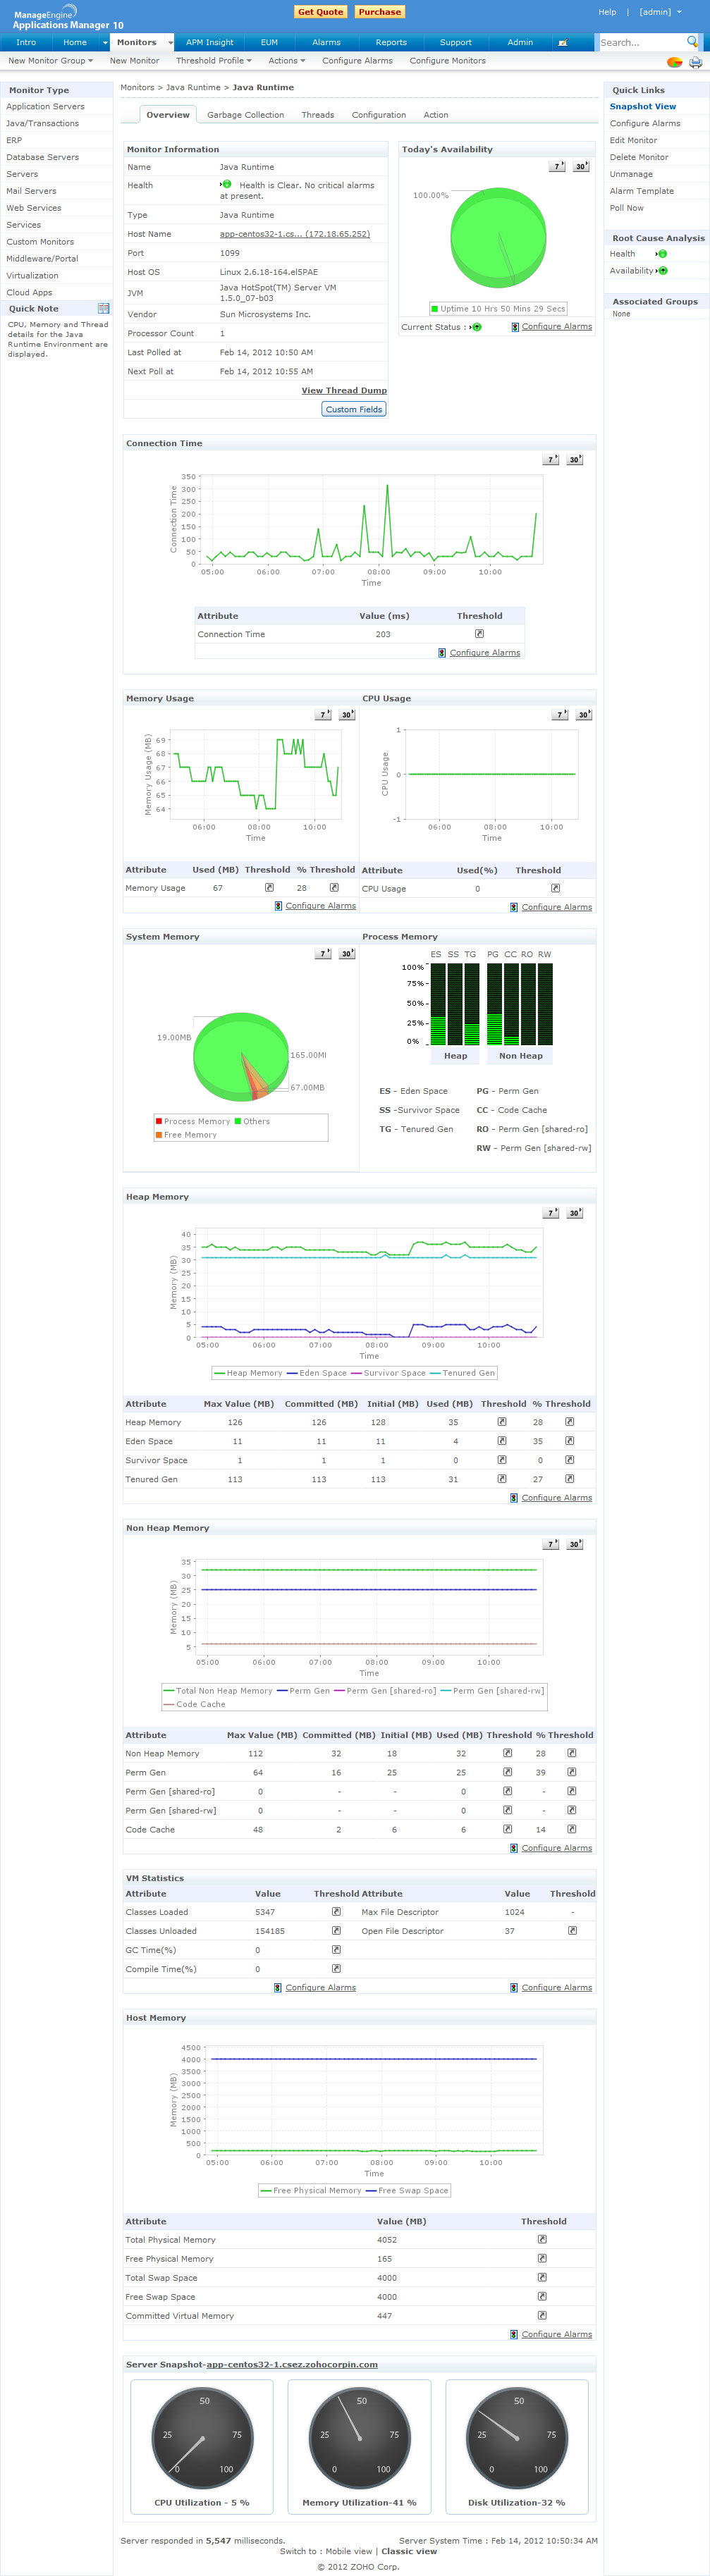
利用ManageEngine Applications Manager Java Runtime 监控功能,可以监控Java平台及运行的应用程序。你可以监控JVM的性能 和 线程。Applications Manager支持 Sun JVM, IBM JVM以及Oracle JRockit JVM。
你可以对各种属性配置阈值,当阈值被超越时,系统自动邮件、短信、SNMP Trap告警通知,或执行自定义脚本或MBean操作。除了可用性和响应时间外,Java Runtime还可以监控以下指标:
| 相关监控功能 | |
|---|---|
| 进程内存参数 | 描述 |
|---|---|
| Eden空间 (堆内存) | 最初为大多数对象分配内存的池 |
| 幸存空间 (堆内存) | 在eden空间的垃圾收集之后池中幸存的对象 |
| Tenured Generation (堆内存) | 在幸存空间中存在了一段时间的池中包含的对象 | Permanent Generation (非堆内存) | 保存虚拟机本身的所有反射数据,如类和方法对象。利用使用类数据共享的虚拟机,此内存可分为只读和读写区域。 |
| 代码缓存 (非堆内存) | 用于编译和存储本机代码的内存。 |
| 线程参数 | |
| 活动线程 | 当前运行的活动线程数 |
| 守护线程 | 当前运行的后台程序线程数 |
| 可运行线程 | 在Java虚拟机中执行的线程 |
| 被阻塞线程 | 被阻止并等待监视器锁的线程 |
| 等待中的线程 | 无限期等待另一线程执行特定动作的线程 |
| 限时等待的线程 | 该线程等待其他线程执行动作,并且等待了指定的时间 |
| 开始的所有线程 | Java虚拟机开启,已创建并开始的素有线程数。 |
| Peak Threads | Peak live thread count since the Java virtual machine started or peak was reset |
| Deadlocked | Number of threads that are in deadlock waiting to acquire object monitors |
| 还可以监控和分析Java应用程序的线程堆栈。 | |
| 虚拟内存参数 | |
| Classes loaded | Number of classes loaded |
| Classes Unloaded | Number of classes unloaded |
| GC time | Time taken to perform garbage collection |
| Compile time | Time spent in just-in-time (JIT) compilation |
| Max file descriptor | Maximum permissible open file descriptor. Available only for UNIX. |
| Open file descriptor | Current count of open file descriptors. Available only for UNIX. |
| 主内存参数 | |
| Total Physical Memory | Total amount of physical memory in Megabytes |
| Free Physical Memory | The amount of free physical memory in Megabytes |
| Total Swap Space | Total amount of swap space in Megabytes |
| Committed Virtual Memory | The amount of virtual memory that is guaranteed to be available to the running process in Megabytes |
| 垃圾收集器 | |
| Time Spent/Min | Total number of collections that have occurred |
| Collections/Min | Approximate collection elapsed time in milliseconds |
| Thread Count | Number of threads used for Garbage Collector |
| Last Start Time | Start time of this GC |
| Last End Time | End time of this GC |
| Memory usage before GC | Memory usage of all memory pools at the beginning of this GC |
| Memory usage after GC | Memory usage of all memory pools at the end of this GC |
| 配置 | |
| Uptime | The uptime of the Java virtual machine |
| Java Virtual Machine | The Java virtual machine implementation name |
| Vendor | The Java virtual machine implementation vendor |
| Process ID | The process identifier is a number used by some operating system kernels to uniquely identify a process |
| Name | The name representing the running Java virtual machine |
| VM arguments | The input arguments passed to the Java virtual machine which does not include the arguments to the main method |
| Class path | The Java class path that is used by the system class loader to search for class files |
| Library path | The Java library path |
| Library path | The boot class path that is used by the bootstrap class loader to search for class files |
| JIT compiler | The name of the Just-in-time (JIT) compiler |
| Objects Pending for finalization | The approximate number of objects for which finalization is pending |
| Operating System | The name of the operating system |
| Architecture | The operating system architecture |
| Processors | The number of processors available to the Java virtual machine |
| You can also use Applications Manager to monitor JVM Performance and capacity planning. | |
Java Runtime监控支持JRE 1.5及以上版本。更多信息,请参阅Java Runtime监控在线帮助。

 400-660-8680