Till now you were able to fix issues before your end users were impacted. But did you ever thought of getting to the root cause of problem? Consider you see a spike in the network traffic which may in turn affect the application performance causing network outage and eventually loss in revenue. For this you have a solution that offers a data granularity of the network traffic. You can quickly and easily identify which users, applications, and protocols are consuming the most network bandwidth easily with NetFlow Analyzer. This will help you to find your fault and get it fixed.
But the exact reason for spike to happen is still not known. To monitor network traffic/bandwidth utilization does not only mean 'to be able to view the present' but to be able to go back in time and find out why a particular spike was generated, so that the spikes and unpredictable network behavior can be avoided in the future. Thus, in order to know where things went wrong and find out exact reason behind it we introduced advanced Forensics reports.
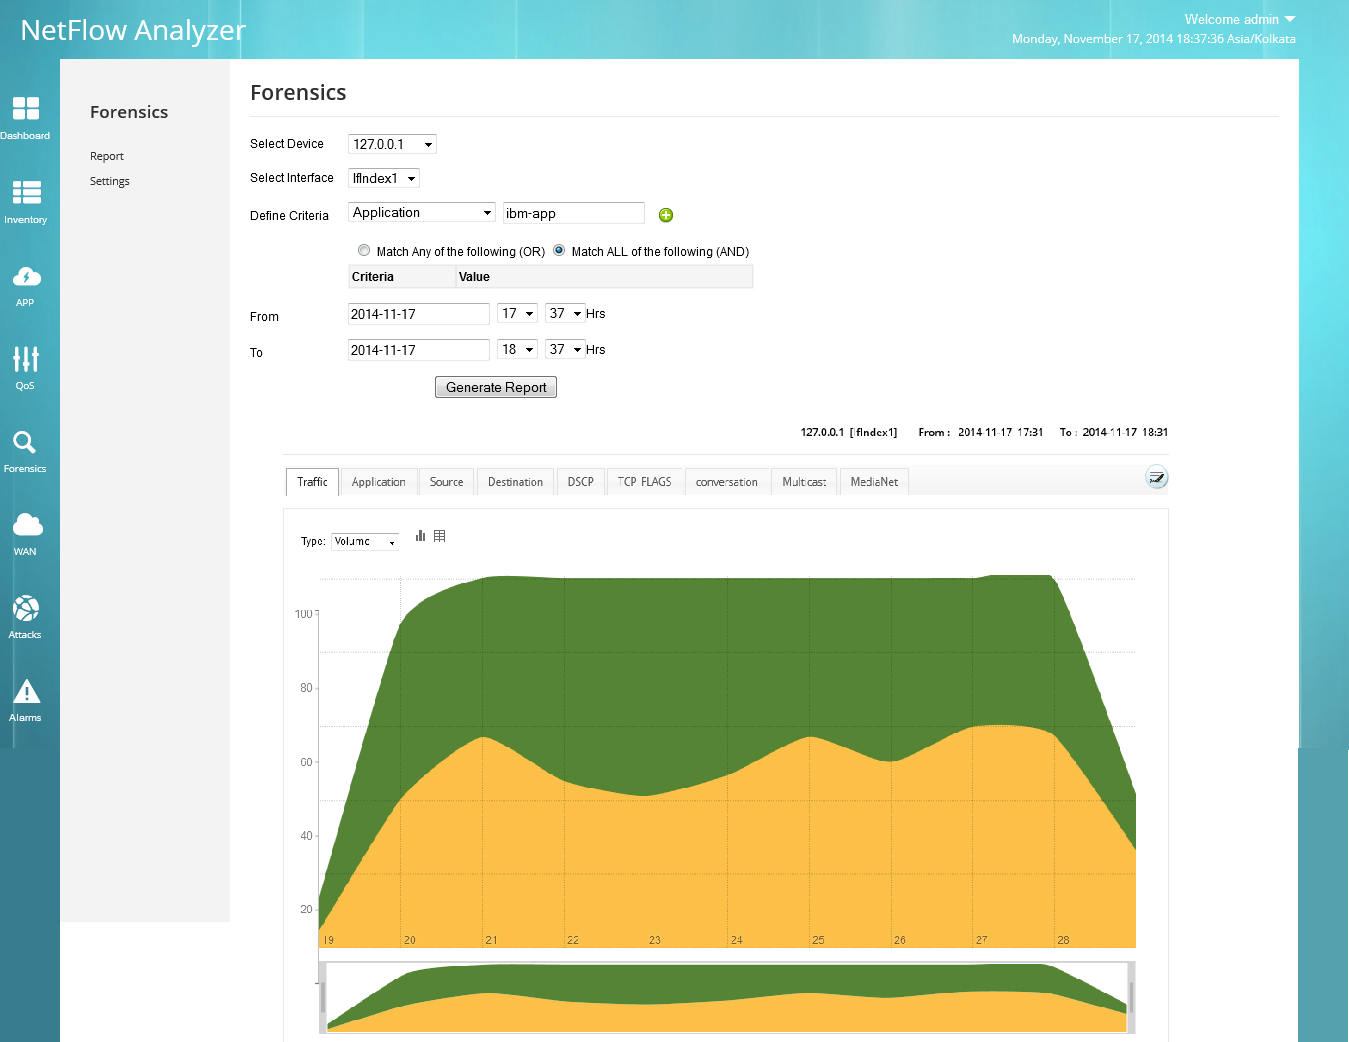
Forensic reports gives you the flexibility to select how far you want to be able to go back to the past and get the required actionable information , which ultimately helps you achieve efficient use of your network bandwidth. It'll change the way you look at troubleshooting your network, hence a network traffic monitor. Forensics helps you, as the name suggests, troubleshoot network incidents faster and drill deeper into any particular element’s traffic based on raw data information. The report lets you select different criteria by which you can generate this particular report and you can even select either "match one of the following" or "match all of the following" along with the specific time period.
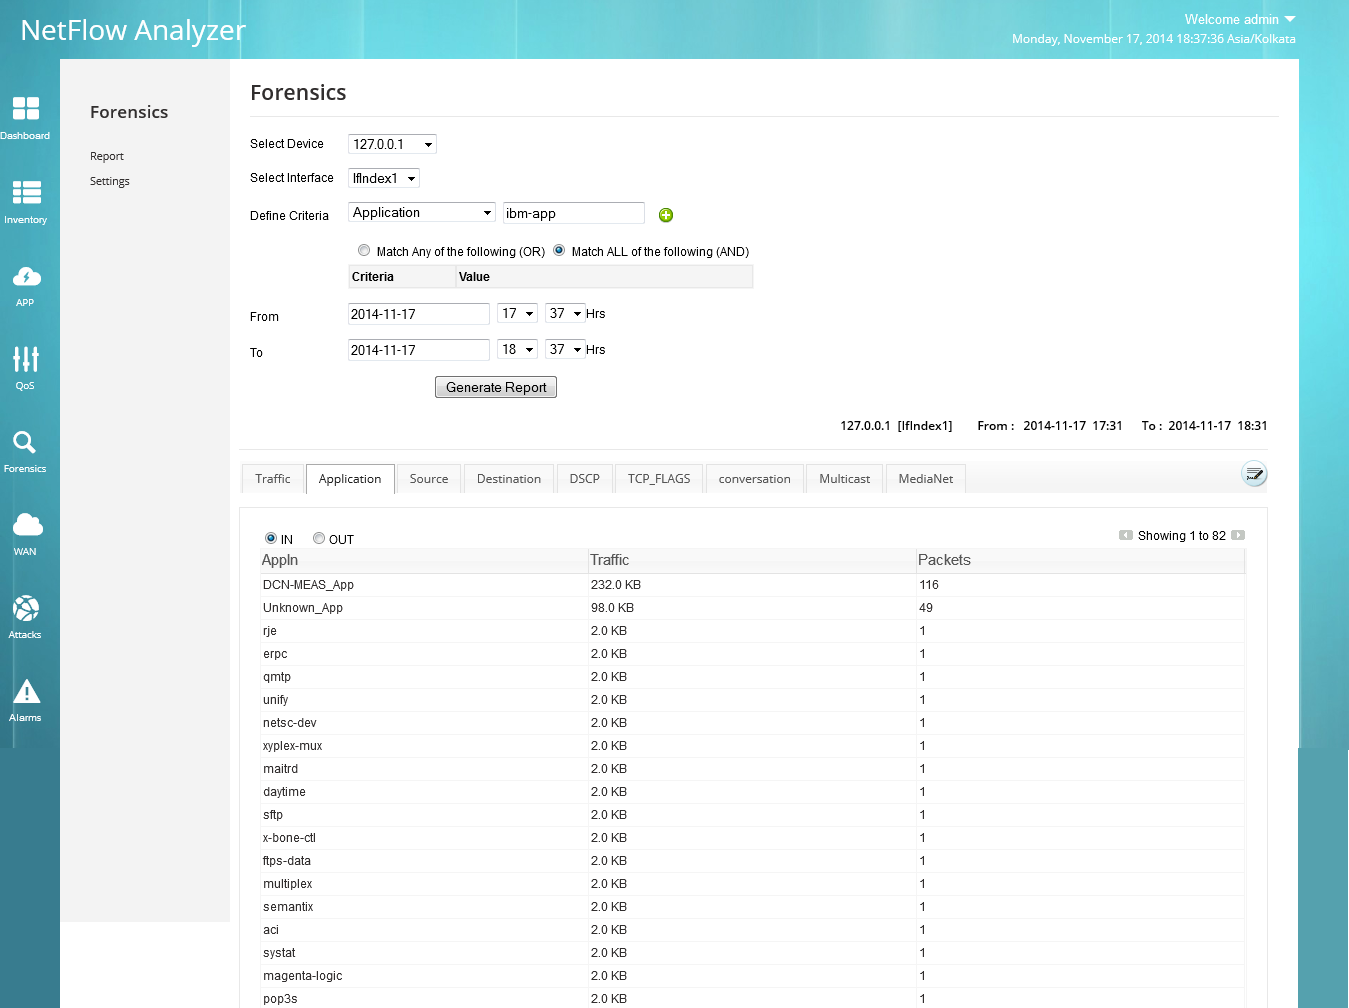
Forensics gives you visibility into specific parameters such as traffic, application, source address, destination address, DSCP etc. at any specific instance. This enables you to identify the root cause of the network issues and anomalies for faster troubleshooting. In order to effectively use forensics, it is recommended to have the HighPerf add-on in order to storage large volumes of raw data speedy report generation. All you need to do is select a particular device, its interface, define multiple criteria, specific time period and click on "Generate Reports".

Voila! You get a report where you can view Traffic, application, source, destination, conversation and more (see the above image) for a particular time period that you selected with tabular or graphical view. That is how simple it is to gain in-depth visibility of the past network traffic and bandwidth utilization.
As simple as that! Really!
Another scenario on how to troubleshoot faster.
Other reports: Search reports
Download | Interactive Demo | Product overview video
NetFlow Analyzer is a NetFlow, sFlow, JFLow (and more) collector and analyzing engine integrated together. NetFlow analyzer does not require any hardware probes and can be downloaded, used in your network environment and can be evaluated for 30 days. Go through the following useful links for better understanding of how NetFlow Analyzer can help you in understanding your network traffic and bandwidth utilization.
 400-660-8680