OpManager gives you insights on your applications by monitoring key metrics of your network, applications and database servers, to help you optimize their performance. These insights are priceless as they help you maximize the performance of your datacenter, which is indeed the goal. Storage plays an indispensable role here as all the data resides in your SAN / NAS network. Wouldn't it be great if you could extend your horizon to include storage devices too. Visibility into the storage part is critical if you need to thoroughly diffuse an application slowdown situation. OpStor arms you with that vision. With the OpStor add-on gain end to end visibility with a single pane of glass view of your entire storage infrastructure. With the Capacity reports, Performance reports and device support for more than a 100 different devices, OpStor completes your storage monitoring needs comprehensively. Interested?!! Scroll down for more.
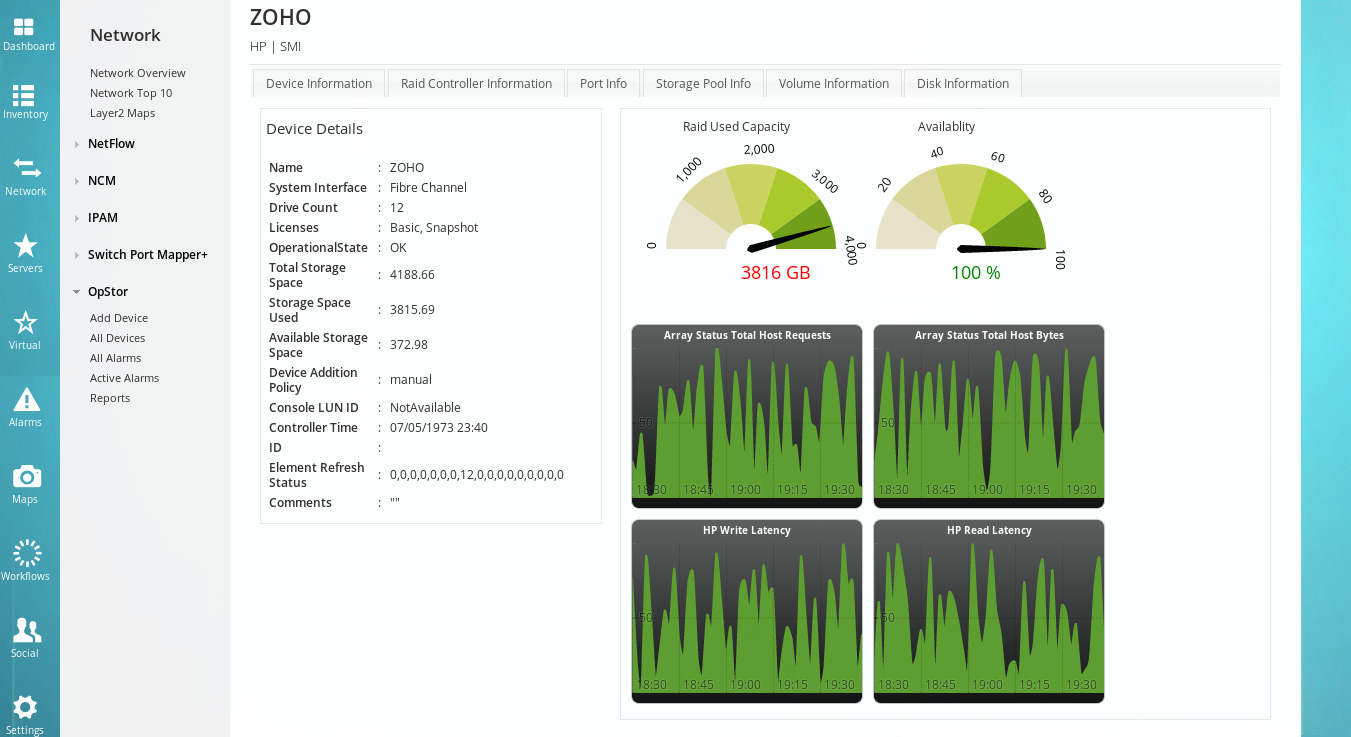
Get detailed device and its component's info from a single page. Admins can view complete info on storage pools, disks, LUNs, RAID group, RAID controller and location. All these metrics when accessed from a single location will help the admin to get a comprehensive overview of the storage array. The device page will give the following details:
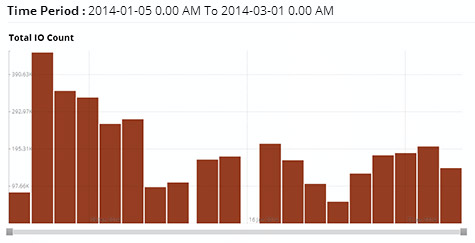
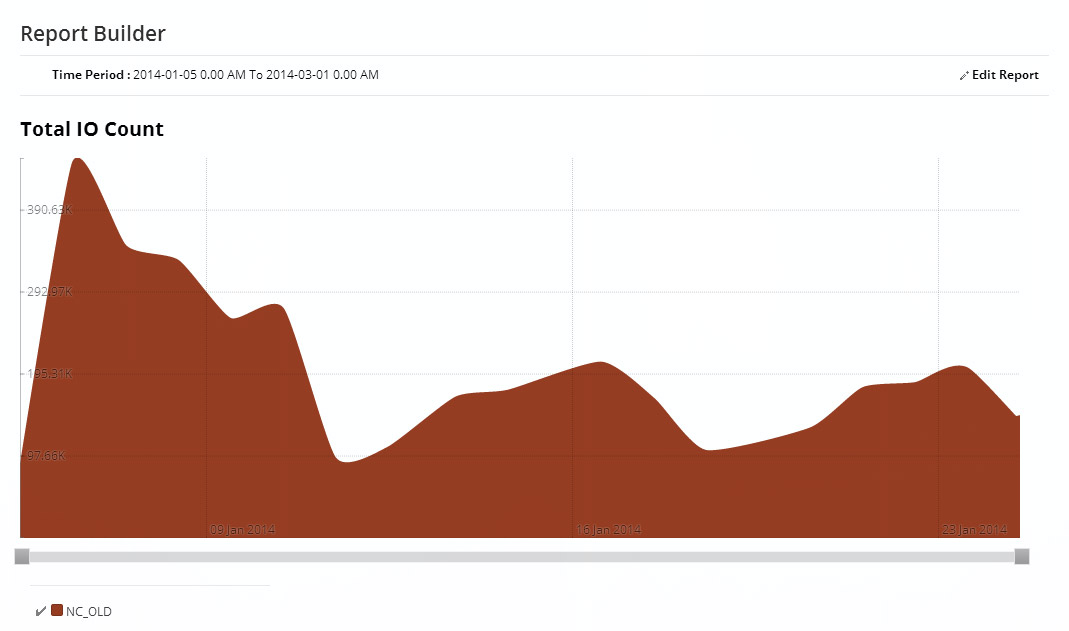
Monitor array statistics like IOPS,Reads and Writes and Cache configuration. These metrics help in evaluating the performance of your storage devices. With OpStor plugin gain insights on performance of your storage devices which is critical while evaluating application slowdowns.
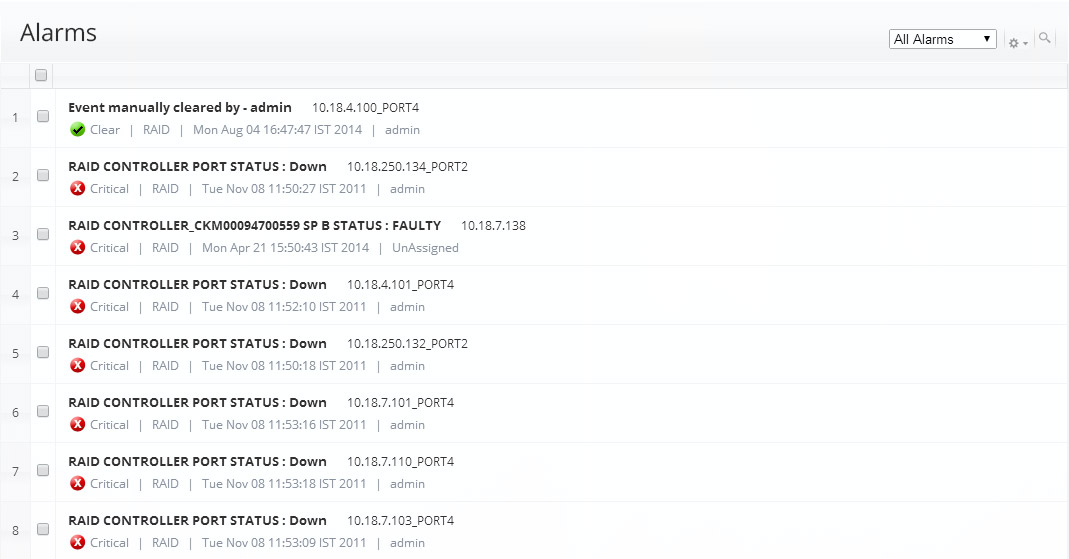
Custom thresholds can be set on various performance metrics of devices. On meeting the thresholds set, the alerts generated can be viewed on a single console thus helping the admin to glance through the most recent and critical events. OpStor plugin helps save precious time and prompts the admin to take corrective action.
Do not compromise on benefits of a single storage monitoring tool just because it doesn't support your device. The OpStor add-on lets you monitor more than a 100 different storage devices ranging from fabric switches and RAIDs to HBAs and tape libraries from several vendors. Also, check out the performance parameters that are monitored for each of the devices.

 400-660-8680