![]() Also Available in PDF format (802 KB)
Also Available in PDF format (802 KB)
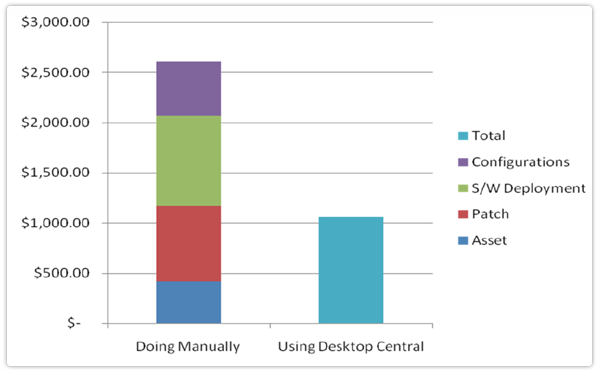
This document will help you arrive at the ROI (Return on Investment) on using Desktop Central versus doing it manually.
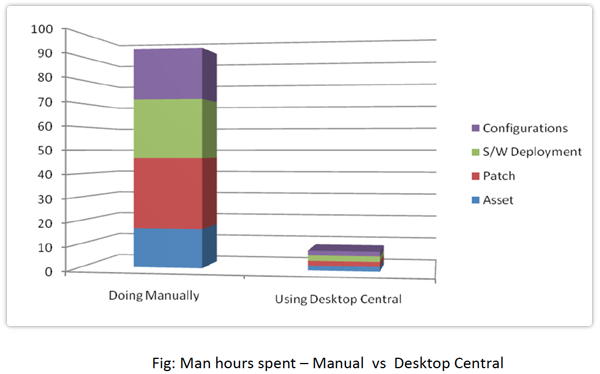
The following graph depicts the time spent on each of these tasks manually versus doing it with Desktop Central. You will save a whopping 90% of cost and efforts when you use Desktop Central.

Note:
The graph shown above is for doing these tasks just once. When you increase the number of times you perform these tasks, you would tend to save even more as most of these taks gets automated in Desktop Central.

Notes:
Now, we will see the break-up of the data shown above for each tasks/modules.
| Task | Time per computer | Total Time for 100 computers |
| Manual Scan to get hardware and software details | 5 minutes | 8.33 man hours |
| Preparing a report on results | 5 minutes | 8.33 man hours |
| Task | Time per computer | Total Time for 100 computers |
| Identify the missing patches for 3rd party applications like Adobe, Java, Firefox, etc. | 3 minutes | 5 man hours |
| Download the required patches from the vendor's website and install them | 5 minutes | 8.33 man hours |
| Identifying the missing Microsoft Patches** | 5 minutes | 8.33 man hours |
| Downloading and Installing the missing Microsoft Patches** | 5 minutes | 8.33 man hours |
** Applicable only if automatic update is not enabled.
| Task | Time per computer | Total Time for 100 computers |
| Deploying a simple software | 3 to 5 minutes | 5 to 8.33 man hours |
| Deploying MS office applications | 15 minutes | 25 man hours |
| Installing Service Packs | 3 minutes | 5 man hours |
| Task | Time per computer | Total Time for 100 computers |
| Configuring display settings, application settings, browser settings, etc. | 3 minutes | 5 man hours |
| Applying security policies, restricting USB device access, file restrictions, etc. | 5 minutes | 8.33 man hours |
| Local user management, mapping drives, installing printers, etc. | 5 minutes | 8.33 man hours |
| Task | Time per computer | *Total time for 'n' computers |
| Installing and setting up of Desktop Central | - | 120 minutes |
| Automating Asset Scanning and Reporting | - | 2 minutes |
| Automating Patch scanning and deployment | - | 5 minutes |
| Deploying a simple software | 2 minutes | 2 minutes |
| Deploying MS Office | 15 minutes | 15 minutes |
| Installing Service Packs | 2 minutes | 2 minutes |
| Configuring display settings, application settings, browser settings, etc. | 2 minutes | 2 minutes |
| Applying security policies, restricting USB device access, file restrictions, etc. | 5 minutes | 5 minutes |
| Local user management, mapping drives, installing printers, etc. | 5 minutes | 5 minutes |
*Note: 'n' ranges from 1-10000.
| Task | Doing Manually | Using Desktop Central | Annual Savings | ||
| Man hours | Cost | Man hours | Cost* | ||
| Performing asset scanning, patch management, software deployment, and configurations once in a year | 114 | $3990 | 2.63 | $1087 | $2903 |
| Perform Asset scanning once in a quarter, install patches once a month (excluding Microsoft Patches), Install software and configure systems once a year | 284.92 | $9972 | 2.63 | $1087 | $8885 |
| Perform asset scanning once in a quarter, install patches once a month (including Microsoft Patches), install software and configure systems once a year | 484.84 | $16969 | 2.63 | $1087 | $15882 |
*- includes an additional $995 towards the annual subscription fee for 100 computers.
Assumption:
| Manual Procedure | Desktop Central |
|
For one system: 8MB*10 patches=80 MB For 100 systems: 100*80MB=8GB |
Once, the patch is downloaded in the server (i.e. 80MB file). It can be deployed any number of times, without any additional consumption of internet bandwidth. Result: Save bandwidth cost up to 100 times. |